
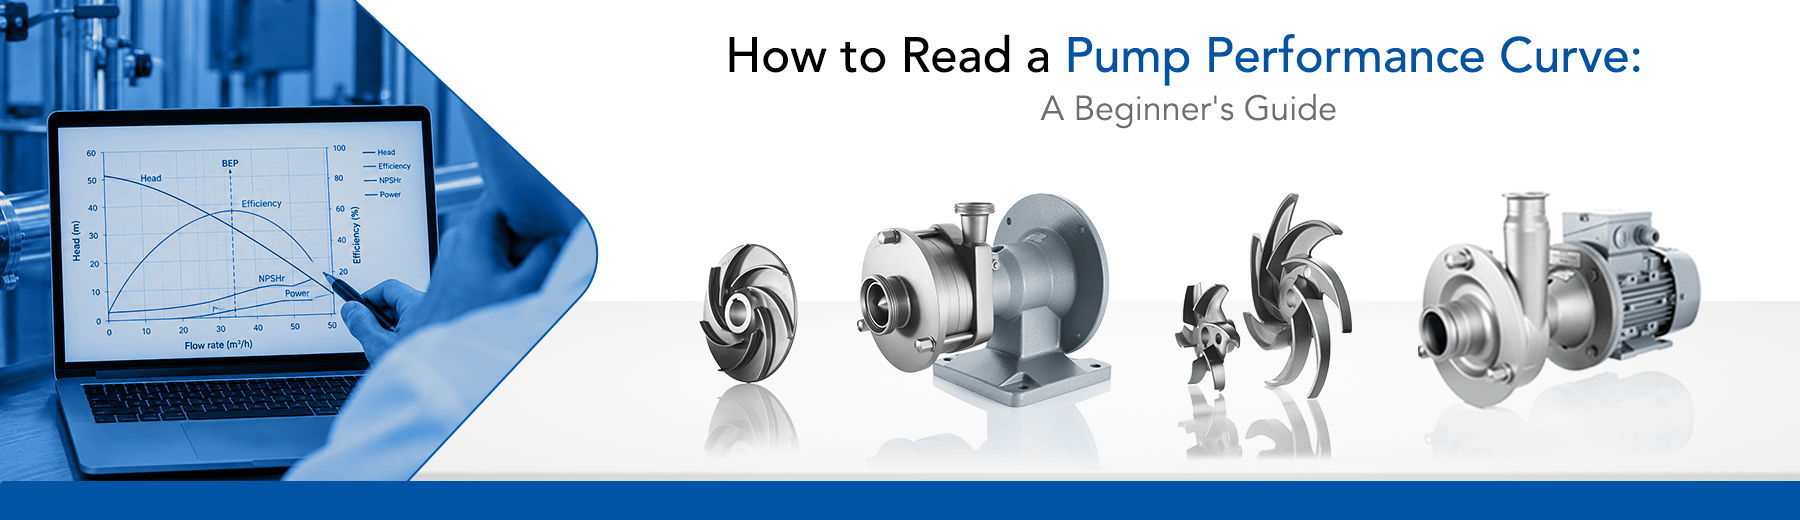
Each centrifugal pump is designed to operate over a defined performance range. This makes understanding the pump’s operating range especially important, as the selected pump must meet the process requirement while still delivering efficient and reliable performance.
The pump performance curve gives the information necessary to evaluate this performance. At first glance, the pump performance chart might seem technical, but each section of it has a definite function in assessing a pump for a specific duty
Let's walk through what a pump curve shows, one element at a time, so you can understand how to read a pump curve with confidence.
Get Familiar With What a Pump Performance Curve Shows
Once you know what each part of the chart is supposed to represent, a pump curve becomes easier to work with. The basic understanding makes the subsequent performance checks much easier:
- Flow rate: Indicates the amount of liquid the pump can transfer in a specific time, usually in m³/h.
- Pump head: Represents the energy the pump adds per unit weight of liquid, expressed as the height of a liquid column in metres. Because the head is expressed as height rather than pressure, it is independent of the liquid’s density.
- Pump efficiency: Indicates the efficiency with which the pump converts the supplied energy into useful hydraulic output at different flow rates.
- Power and NPSHr: The curve may also show the power required and the Net Positive Suction Head Required (NPSHr) at different operating points. NPSHr is a head value representing the minimum NPSH the pump requires at a given flow. The system’s NPSHa should remain above it with an appropriate margin to reduce the risk of cavitation and performance loss.
NPSHr is the Net Positive Suction Head required by the pump at a given flow rate and is expressed as a head value. It generally varies with flow and is shown on the pump performance curve. The NPSH available from the system (NPSHa) should remain above the pump’s NPSHr with an appropriate margin at the intended duty point; if the available margin is insufficient, the risk of cavitation and reduced pump performance increases.
Begin With Flow Rate and Head
The two primary values to look at first on a pump performance curve are flow rate and head. The flow rate is usually represented on the horizontal axis and indicates how much liquid the pump can move. This is commonly shown in cubic metres per hour (m³/h). The head is shown on the vertical axis, in metres.
A centrifugal pump performance curve usually shows that, for a given impeller diameter and rotational speed, head generally decreases as flow rate increases. A good starting point to understand if the pump can meet the required process duty is to look together at these two values before moving on to efficiency, power and other performance details.
Check the Other Details That Matter on the Pump Performance Chart
Having determined the main duty point, the next step is to analyse the values affecting the pump’s performance around that point. These details provide a more complete picture of the operating behaviour of the pump:
- Confirm the pump model. Check that the curve belongs to the exact pump size or model being considered. Different models within the same centrifugal pump range can have different performance characteristics.
- Check the rotational speed. Pump curves are produced for a stated operating speed. A change in speed changes the pump’s performance, so the RPM shown on the curve should match the intended operating condition.
- Note the impeller diameter. Some curves show performance for different impeller diameters or trims. Make sure you follow the line that corresponds to the impeller fitted or being selected.
- Check the test basis. Published centrifugal pump curves are generated under defined test conditions, normally using water. When pumping more viscous products such as cream, syrup or concentrate, the published curve should be corrected for the actual viscosity, as higher viscosity reduces flow, head and efficiency while increasing the power required.
Locate the Pump’s Working Point
The working point or operating point of the pump is the point of intersection of the pump performance curve and the system curve. The pump curve analysis shows the head that the pump can develop at different flow rates, and the system curve shows the head that the piping system requires at different flows. The intersection of the two curves is the flow rate and head at which the pump will actually run.
Note: Once the operating point has been determined, check its position relative to the Best Efficiency Point (BEP) and the recommended operating range. Operating well to the left of BEP, at low flow, can cause internal recirculation, heating and vibration, just as operating far to the right increases NPSH demand.
A pump may be capable of delivering the required flow and head, but that alone does not confirm that it is the best choice for the application. Process requirements, power consumption and overall operating conditions should also be assessed before finalising the selection.
See What Can Affect Pump Performance
The same pump may behave differently when the process state changes. Before you depend on the curve alone, it is useful to consider a few variables that can impact the actual operating result:
- System resistance changes. Closing a valve, adding bends or altering the pipework increases system resistance, changes the system curve, and generally reduces the resulting flow.
- Air in the suction line. Air leaks on the suction side can disturb the flow entering the pump and result in lower or unstable performance.
- Deposits or obstructions. Product build-up in the pipework or deposits in the impeller can restrict flow and prevent the pump from delivering the expected output.
- Incorrect rotation. If the motor is rotating incorrectly after installation or maintenance, the pump may give lower flow and head than expected. Confirm rotation against the arrow on the pump casing before running.
Match the Pump Curve With the Process Duty
The pump should not be chosen on flow rate alone. Head, efficiency, power demand, NPSHr and actual product conditions all need to be considered together. Analysis of these values collectively allows you to confirm whether the pump can reach the required duty in an appropriate operating range.
At Fristam, individual pump performance curves help us match the pump size and configuration to the actual process duty.
- The FP series covers a broad range of hygienic applications, and its flow-optimised channel and impeller vane angles help keep NPSH requirements low and give more margin on the NPSHr line where suction conditions are limited.
- The FPH series is designed for higher-pressure duties and the FM multistage pump for applications requiring higher delivery heads.
- For high-purity pharmaceutical and biopharmaceutical processes, the FPV series provides a dedicated centrifugal pump option.
Turn Pump Curve Analysis Into a Better Pump Selection
Start with flow and head, locate the duty point, and then check that it sits within the recommended range on either side of the BEP. Efficiency and power requirements should also be reviewed, and the NPSH available from the system checked against the NPSHr shown on the curve, before making a pump selection. Actual product properties and operating conditions matter as well, since they can affect how the pump performs in practice.
A pump performance curve becomes much easier to understand once each part is read in the right order. For the right pump selection, the complete process duty should always be considered rather than relying on a single value from the curve. If the application requires more demanding process conditions, Fristam can assist with the evaluation of the duty and help to define a pump configuration that is a better match to the process.
Frequently Asked Questions
1. What is a pump performance graph?
It is a graph that shows how pump performance changes with flow rate, with values such as head, efficiency, power and NPSHr.
2. How to read a pump curve?
Start with the flow and head required, determine their location on the curve, then check efficiency, BEP, power and NPSHr.
3. What do flow rate and head mean in a pump curve?
Flow rate shows how much liquid is moved, while head represents the energy added to the liquid.
4. What is pump head and how is it calculated?
Pump head is the energy the pump adds per unit weight of liquid, expressed in metres of liquid column. It is calculated from the difference in total head between the pump suction and discharge, considering pressure head, velocity head and elevation. The required system head also must include the friction losses in the piping and fittings.